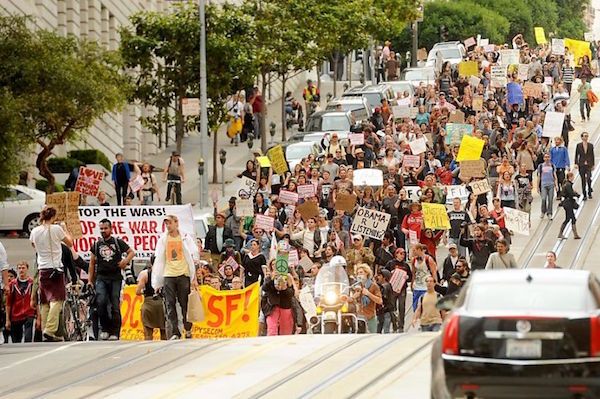
In what came as a surprise to absolutely no one, San Francisco ranks in the top 10 U.S. cities with the greatest degree of income inequality.
According to a recent study by the Brookings Institution, income inequality has increased across the United States over the last couple years, and particularly in major cities and metro areas.
Brookings calculates inequality by comparing income among households earning more than 95 percent of other households (the 95th percentile) with those earning more than only 20 percent of other households (the 20th percentile). It calls this the "95/20 ratio." Between 2007 and 2014, the nationwide 95/20 ratio climbed from 8.5 to 9.3, while in big cities the ratio was much higher—an average of 11.8. According to the analysis, Boston has the widest income gap in the country.
Meanwhile in San Francisco, the estimated rate of income growth for wealthy households topped 18 percent, equivalent to a $66,000 bump. SF also stands apart from the pack in just how rich its richest households are: They earned at least $423,000.
Things aren't looking too bad for SF's 20th-percentile either, which rose from $21,500 in 2012 to $24,800 in 2013, a 15 percent jump that registered highest among the 50 cities.The Census Bureau is quick to note that these incomes could have increased in part due to very-low-income households leaving the city. To which we replied, "duh."
The East Bay was not immune. Oakland also saw significant income growth at the lower end. Although, low-income households in Oakland are also experiencing affordability pressures as rents continue to rise.
Top 10 U.S. Cities Where Income Inequality Is Growing Fastest:
1. Boston
2. New Orleans
3. Atlanta
4. Cincinnati
5. Providence
6. New Haven
7. Washington D.C.
8. Miami
9. San Francisco
10. New York City
Related Articles
